
 Show All
When you check your station's AQH rating in a particular survey, the reported value is based on a population sample and is only an estimate of the actual rating for the entire market population.
The Ratings Reliability Estimator calculates measures — standard error and confidence interval — that can help you determine a likely range of ratings estimates for the whole population.
Standard error is a statistical term for the amount of uncertainty involved in estimating a rating. When you survey one possible random sample of the population, the result will be different than the result of surveying another possible random sample of the same population. The variation in these hypothetical estimates over all possible samples is called sampling error. The standard error is a measure of this sampling error.
Confidence interval provides you with a range of plausible values for the actual population average. While the range tells you it is likely that the actual population rating is somewhere within the range, it is most likely that the population estimate is the value originally displayed. The values at the extreme ends of the range are least likely. You set the confidence level for determining the confidence interval range. By choosing a larger percentage (between 50 and 99), the likelihood increases that the interval range includes the population rating.
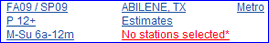
View a sample of the report as a table:
Different views...You can view or print a PDF version of the report. You can also export the report to a comma-delimited .csv file which will look like the table view without formatting.
Table view shows multiple demos, multiple dayparts, and multiple estimates in a single report. It is a vertical orientation that allows you to use the most possible estimates.
Pop/Intab view shows the qualitative population and in-tab. This same information also appears at the bottom of the one-page printed report.
1 Select a market and then a survey with the parameter links at the top.
2 Choose gender and an age range to select a standard demo.
OR click the Custom tab to create a demo that includes socioeconomic characteristics:
• Select gender, the start age and end age in the Available box.
• Click Add More Characteristics to include respondent level data:
– Click an item in the Questions box to highlight it.
– Choose an option from the Answers box and click Add to move the characteristic to the Selections box.
– Repeat to add as many characteristics as needed.
 Use the Remove, Clear Row, and Clear All links if you change your mind.
– Click OK.
– Click the ![]() arrow to move the custom demo to the Selected box.
arrow to move the custom demo to the Selected box.
• Click OK.
3 Select dayparts in the Available box:
• Select one or more standard dayparts then click the ![]() arrow to move all highlighted dayparts to the Selected box.
arrow to move all highlighted dayparts to the Selected box.
• OR create and select a combo daypart:
– In the Standard tab, press and hold Ctrl, then click two or more dayparts.
– Click the  button to add the combo daypart to the Selected box.
• OR define and select a custom daypart:
– Open the Custom tab.
– Select day(s), a start time and an end time.
– Click the ![]() arrow to add the new daypart to the Selected box.
arrow to add the new daypart to the Selected box.
• Click OK.
4 Select stations to include in the report:
• Click the In the Book link.
• Click to highlight stations in the Available box and then click the ![]() arrow to move them to the Selected box.
arrow to move them to the Selected box.
• Click OK.
5 Choose estimates:
• Click the Estimates link.
• Highlight estimates in the Available box and click the ![]() arrow to move them to the Selected box.
arrow to move them to the Selected box.
• To change the order of the selected estimates:
– Highlight one of the estimates in the Selected box.
– Click one of the  arrow buttons to move the highlighted selection to a new position.
• Type a whole number from 50 to 99 (inclusive) to set a confidence level.
Standard confidence levels are 90 and 95 percent. You must enter a confidence level.
• Click OK.
A # appearing as a ratings point estimate means the estimate is less than one-tenth of a point. For a persons estimate, a # denotes an estimate less than 100 persons. The report includes a footnote.
Ratings estimates — understanding their quality
